
Summary
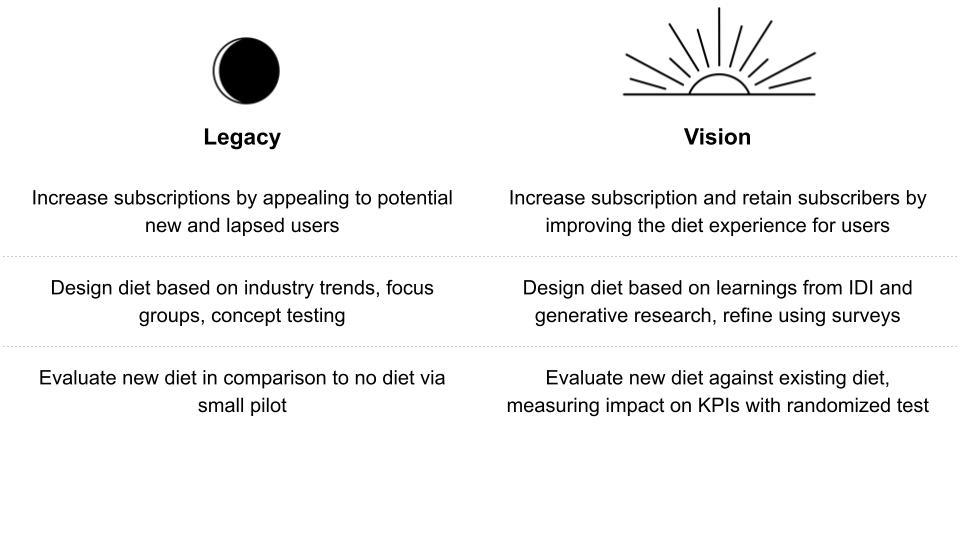
WW paid subscribers felt like the diet was too hard. I had a bold idea: let’s design a diet based on users’ needs. I set out to do the research for a first-of-its-kind user-centered diet. The new diet increased subscriber retention by 13 percentage points.
One year into working as a UXR at WW, I started to understand how the diet was developed and strategized how UXR could support the development of a more user-informed diet. I secured leadership buy-in on a multi-phased research plan. I shared plans, updates, and results with the executive team via bi-weekly meetings throughout. The result? WW’s first-ever personalized diet significantly increased retention and improved user sentiment.
Background
Problem
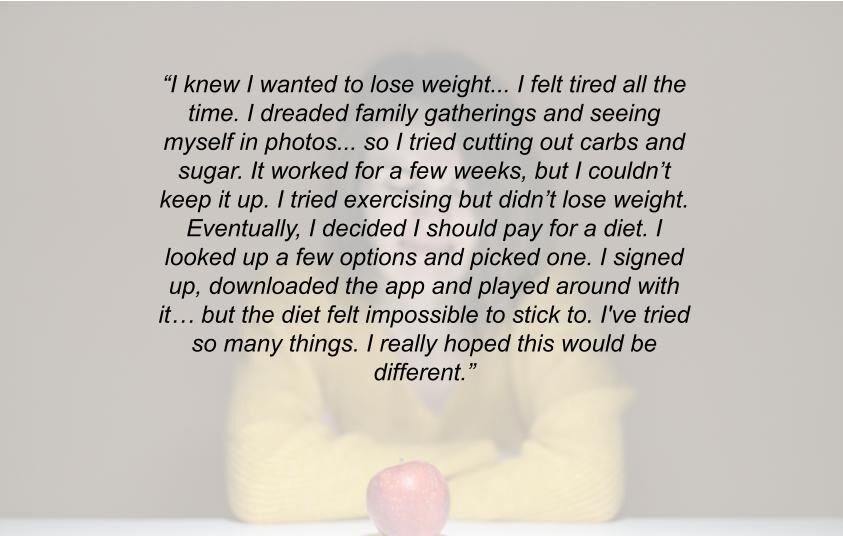
The WW diet was difficult for WW members to follow.
Goal
The WW diet is easier to follow, and as a result, WW members are able to stick with it for longer.
Process
Team
- 1 PM lead
- 1 PD lead, 1 PD, 1 CD
- 2 data scientists
- 1 UXR
- 12 SWE
Timeline
~10 months
Note: worked with several product crews simultaneously
Tools
- R
- Qualtrics
- Mural
Role
- Lead research end-to-end, identifying research questions, developing strategy, involving cross-functional partners, drafting research plans and materials, carrying out research, and sharing results
- Develop relationships with new teams
- Built trust and credibility with leadership
- Represented Product and Design in meetings with leadership
Step 1: IDIs & Generative Research
Coming Soon
Step 2: Iterative Improvements
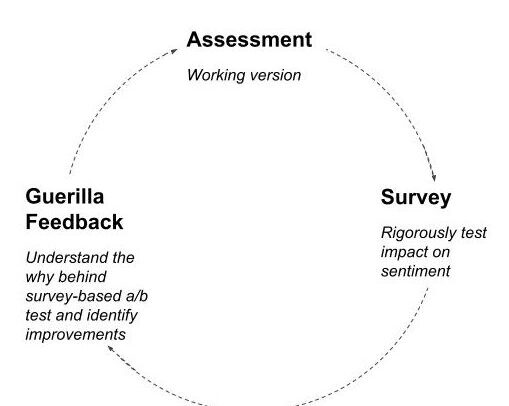
Research questions
- Which version of the assessment and matching heuristic leads to the most positive sentiment and why?
- What should we test next based on what we learned?
Methods
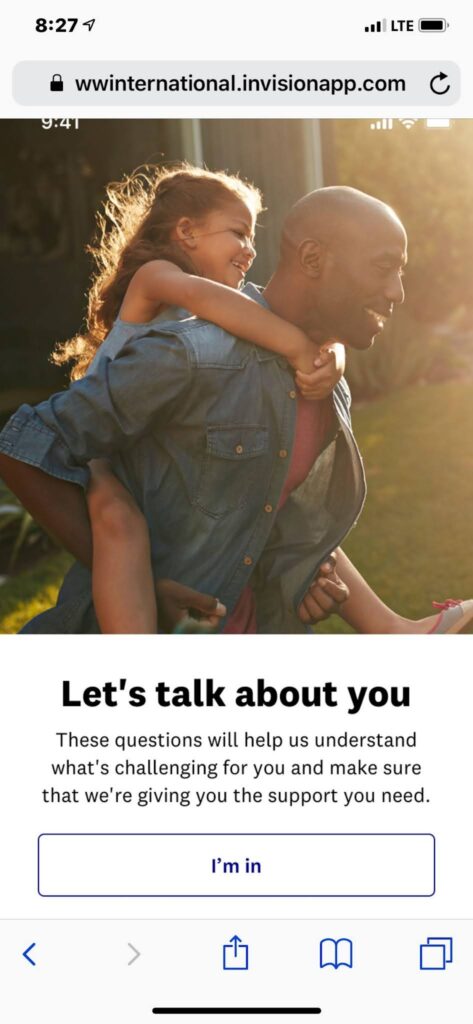
- Survey-based A/B Test of Assessment
- Flow: Respondents were randomly shown version a or b of the assessment, then shown information about the diet and asked sentiment questions.
- Sample: 1000 individuals with quotas for male v female, age, etc., based on member profile; US-only
- Outcomes: Sentiment (belief diet will work for me, perceived ease, and likelihood of signing up)
- Analysis: t-test difference in means
- Report: statistically significant t-test results, descriptive stats for key outcome
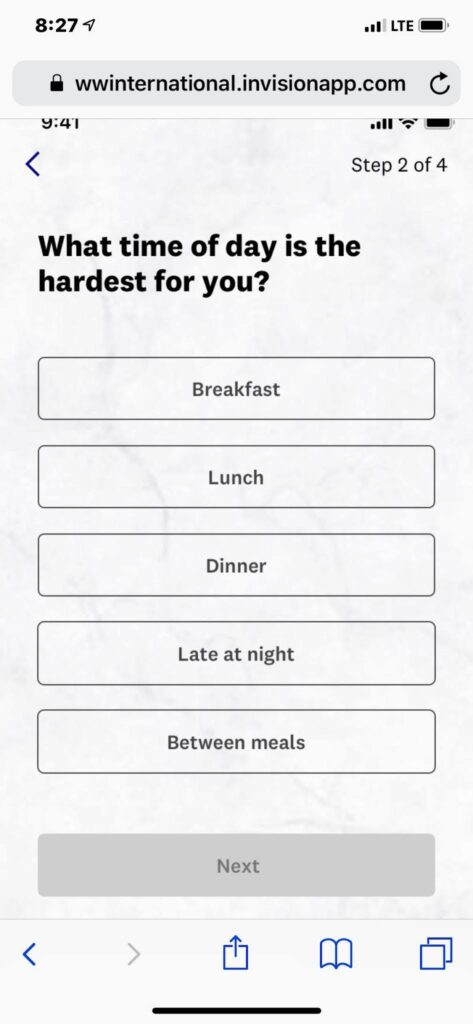
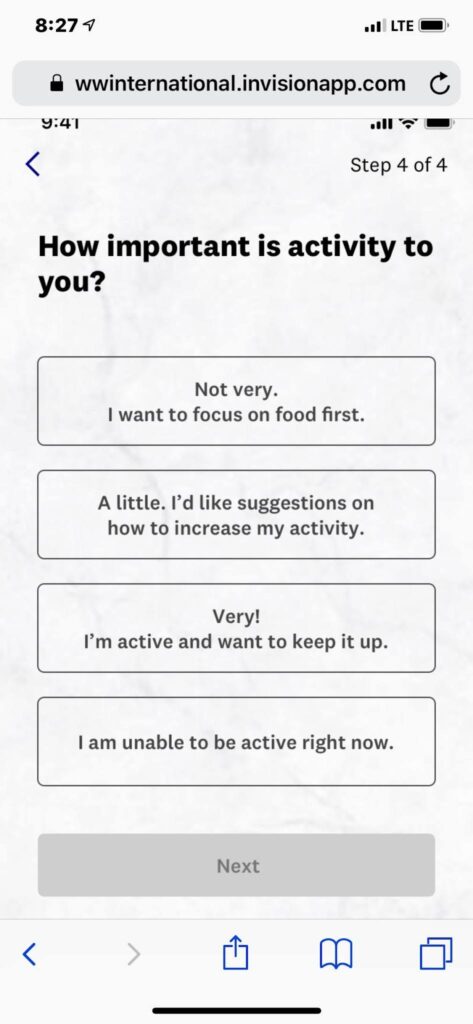
Design
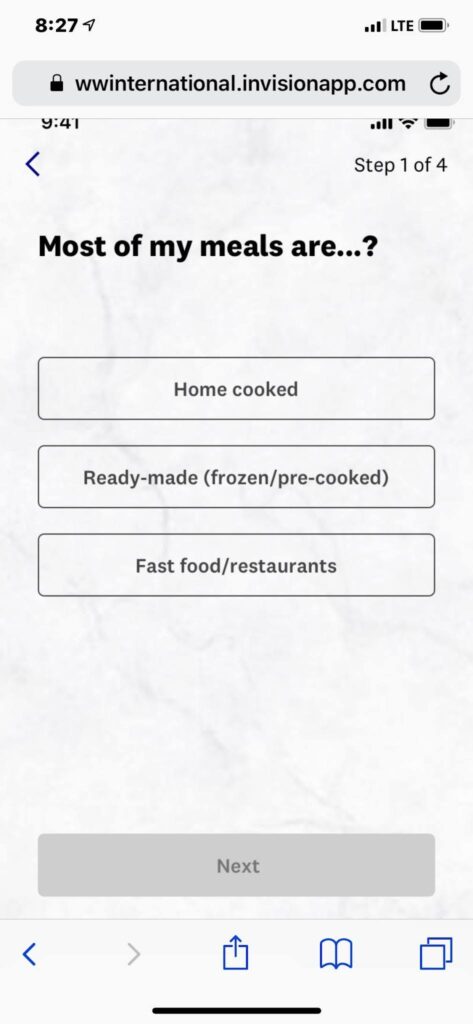
Example Findings + Next Steps
Survey Findings
Assessment A led to lower perceived ease and lower likelihood of signing up compared to Assessment B.
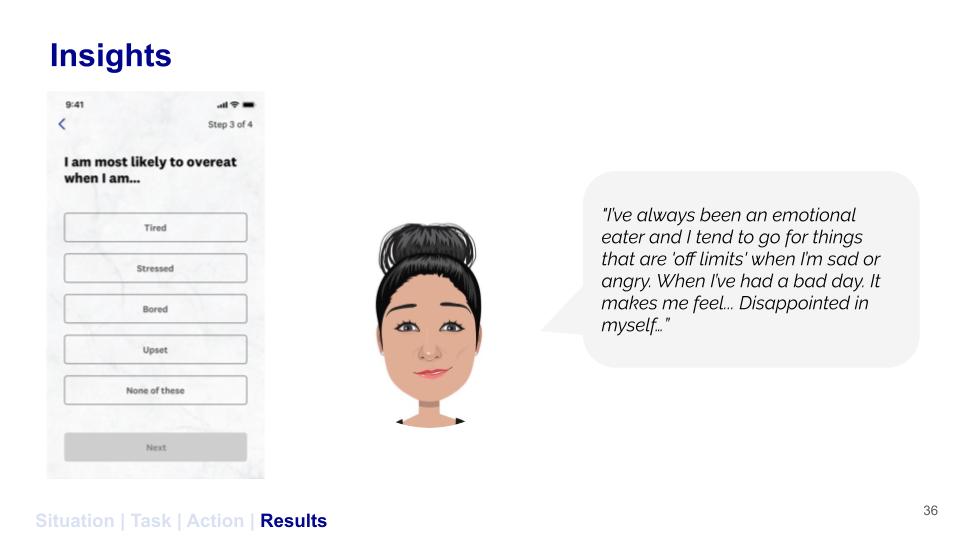
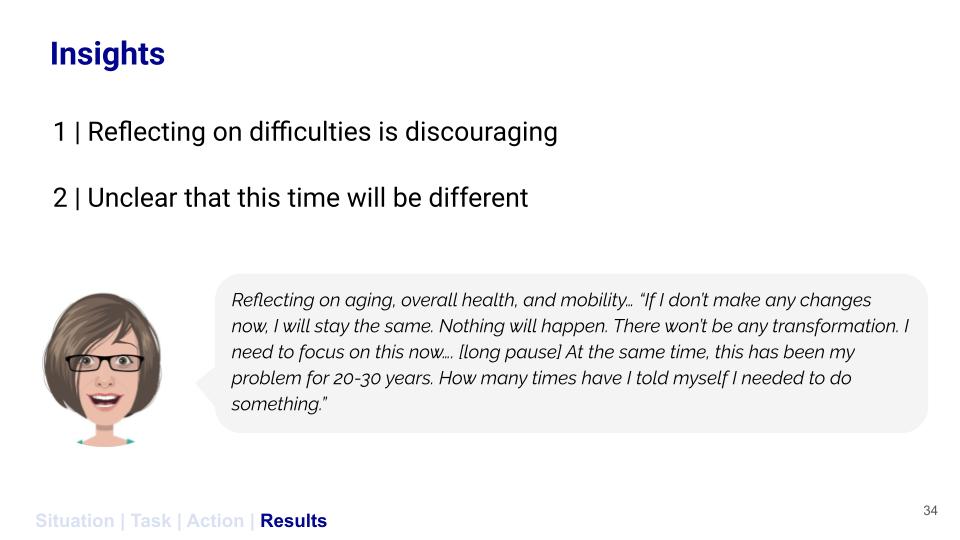
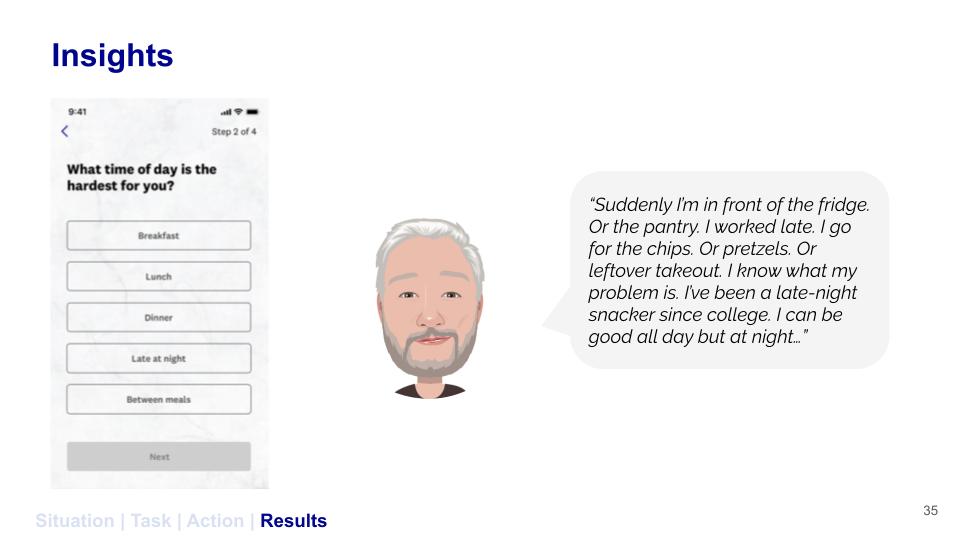
User Feedback Findings
Questions that prompted people to think about their bad habits and difficult times of the day made them worry that this time wouldn’t be different.
Follow-up
- Met with partners who I anticipated would require more 1:1 discussion
- Got buy-in to update copy; incorporated into build
- Gained trust from brand and science partners
Step 3: Pilot
Process
Given that I was proposing a new way of developing and testing the companies largest investment, I communicated the overall plan and timeline against leadership decision points early, often, and through different means.
Methods
- Our last step was to test whether the personalized plans performed better than the control (a single plan). We’d measure success based on retention, perceived ease, and weight change.
- Given that the personalized diet wasn’t built, I got creative and rigged qualtrics for the task, assigning participants to personalized diet plans based on the questionnaire we’d developed and automating getting started emails and instructions based on this logic.
- We recruited 800 people to join the study, including people who had never been on WW and people who were past members.
- Participants completed weekly surveys for 8 weeks, sharing their weight and perceptions about the experience.
Company leadership felt that knowledge of multiple plans would make dieters less likely to stick to their plan (e.g. the grass is greener) which was their rationale for only ever offering one diet at a time. This became a key hypothesis to test through the pilot.
Results
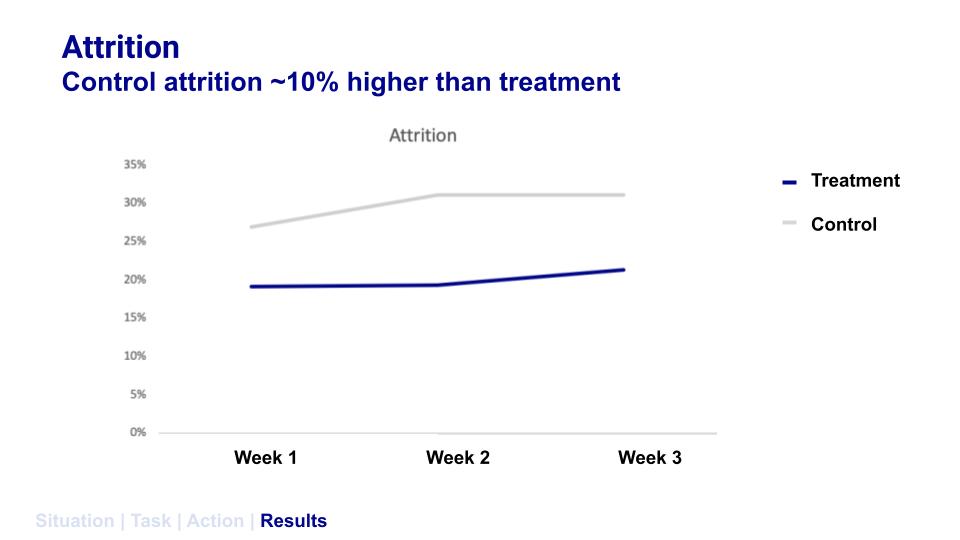
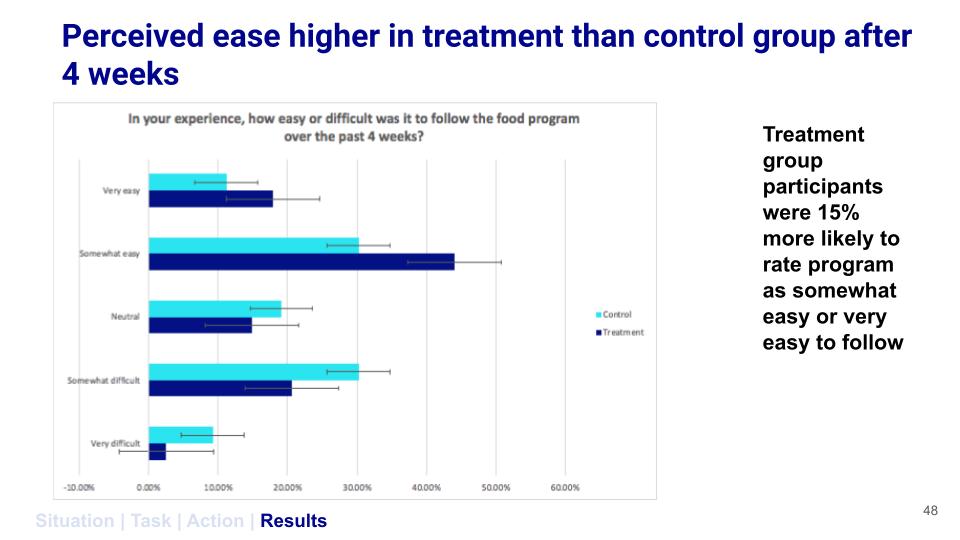
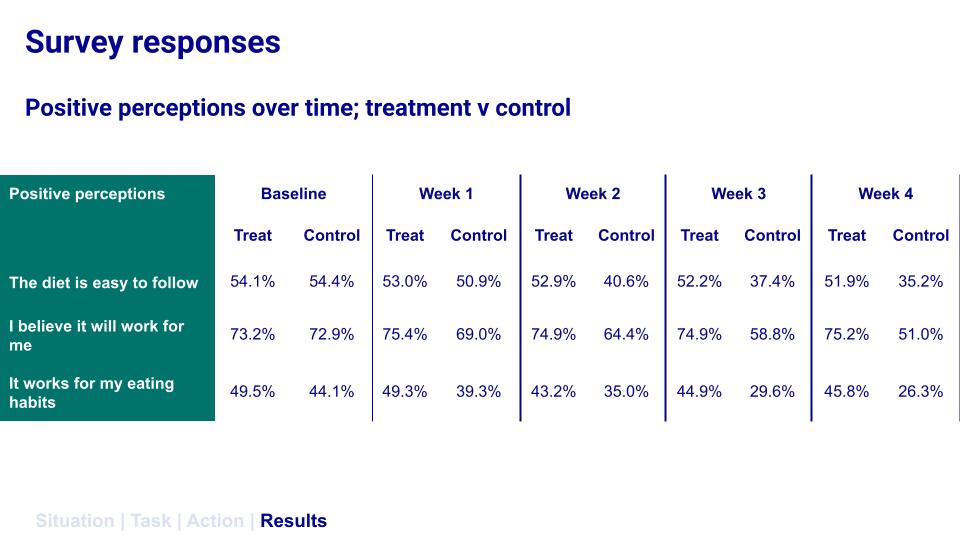
The personalized diet was associated with higher retention and more positive perceptions compared to the control.
Belief that the diet would work and perceived ease improved from the beginning and differences in perception persisted over the course of the study.

Impact
The new diet launched in November 2020 and had a positive impact on key business and product metrics
+ 13 percentage point increase in retention
-15 percentage point decrease in early disengagement
Thank you for reading my case study!
Want to work with me? Feel free to contact me!
…or just say hello on my social media.